At GreenSight, our research focuses on understanding algal growth and physiology through intelligent sensing and data analysis. By combining optical measurements with advanced signal processing and machine learning, we investigate how environmental conditions shape biomass development over time. This approach allows us to move from raw sensor signals to meaningful biological insights, revealing growth dynamics, rhythmic patterns, and stress responses in algal cultures
2025

Optical Monitoring of Biomass Growth
The figure shows the temporal course of optically measured biomass. Alongside the raw data, a smoothed function derived from the measurements is displayed, which closely follows the data points.
During the ten-day observation period, the biomass increases about fivefold, though temporary declines are also apparent. Whether these represent true biological fluctuations or measurement errors remains to be clarified through further investigation. In addition, oscillations can be discerned in the signal, which become more evident when examining the derivative of the curve.

Optical Analysis of Biomass Growth Rate
The derivative of the curve represents the temporal change in biomass and thus the current growth rate. Oscillations are again visible, though they diminish toward the end of the observation period. These fluctuations appear to follow an approximate daily rhythm.
Overall, the growth rate remains predominantly positive, consistent with the general increase in biomass already shown in the previous figure.

Circadian Rhythm in Biomass Growth
To examine the daily rhythm of the oscillations in more detail, this figure shows a magnified section of the previous graph. The time stamps confirm an approximately 24-hour cycle, consistent with a circadian rhythm. The data also indicate that algae grow primarily during the night, while the minimum of their growth phase occurs around midday.
Time resolved fluorescence tomography
Investigators: Franz-Josef Schmitt, Fabian
Rieder
The Figure shows a lifetime plot of the pH values in a microwell plate determined with time resolved fluorescence tomography and pH sensitive marker molecules (fluorescein-isothiocyanate, FITC)
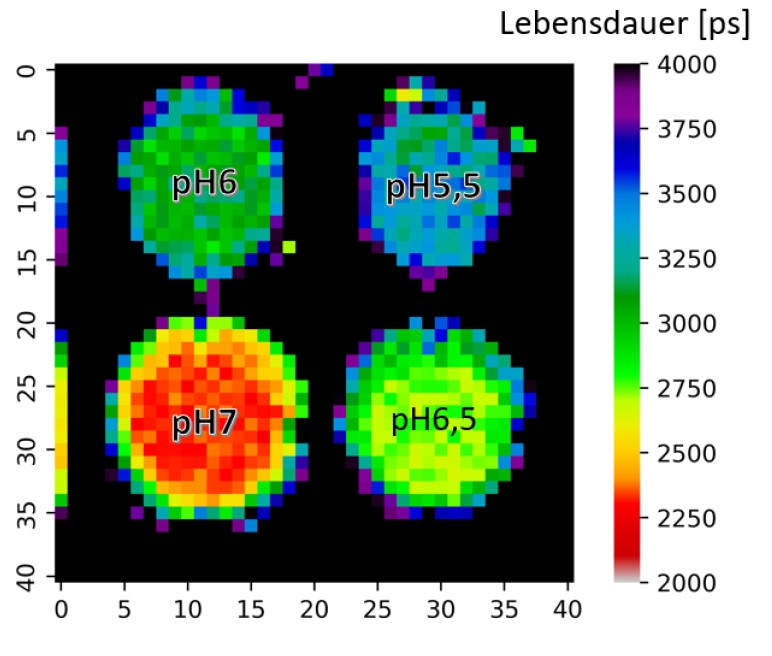
The group investigates time-resolved fluorescence tomography (FT) for three-dimensional visualization of fluorescent tissues with quantitative depth sensitivity. One goal is the determination of the local pH value by combining time resolved fluorescence with pH sensitive marker molecules.
In FT, tissue is excited—typically in the near-infrared window—and the resulting emission is recorded at multiple surface positions and viewing angles. Specific fluorescence markers with pH dependent fluorescence lifetime can be used to generate a 3D pH map of the tissue based on the local fluorescence lifetime (See Fig.).
The fluorescence lifetime is widely independent of the chromophore concentration and only marginally distorted by autofluorescent signals so that it represents a much better ruler for the pH as intensity based measurements.
Performance is assessed using tissue-mimicking phantoms and ex vivo samples to quantify spatial resolution, sensitivity, contrast-to-noise ratio, and absolute concentration accuracy.
Fluorescent molecules in cancer diagnostics
Investigator: Franz-Josef Schmitt
The figure shows that targeted mutations enhance fluorescent proteins by optimizing chromophore stabilisation, chromophore-water-interaction and excited-state proton transfer for bright sensors with strong pH sensitivity.
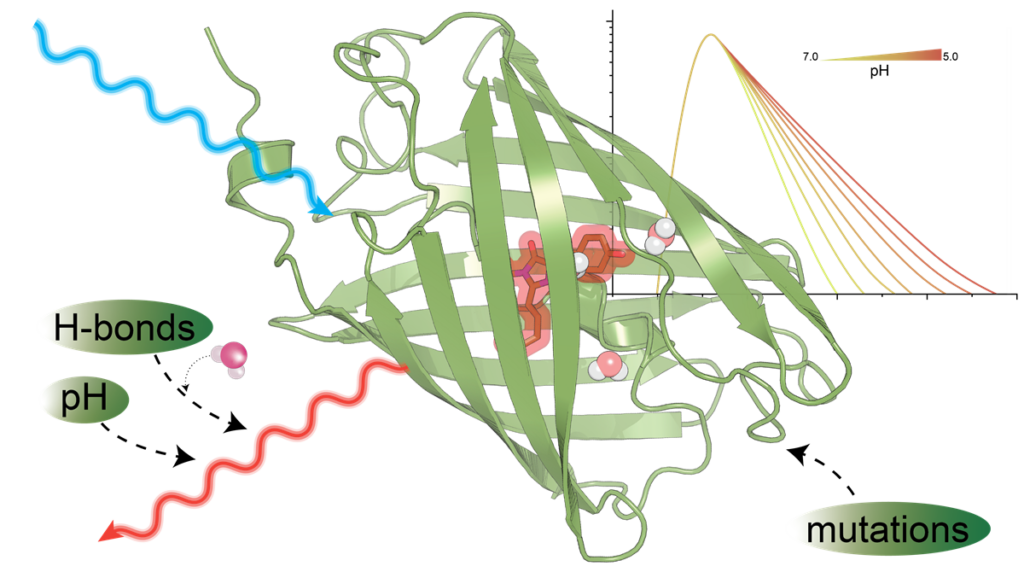
We dissect the pH dependence of far-red fluorescent proteins by coupling broadband absorption/emission spectroscopy with multichannel time-correlated single-photon counting (TCSPC) and decay-associated spectra (DAS) analysis. Kinetic models fitted to the DAS reveal the pH dependency of intramolecular relaxation channels and help to understand the interaction of the molecules with protons and support the specific design of optimized pH sensors.
Molecular dynamics (MD) at different protonation states rationalize the observed photophysics and give rise to understanding the role of specific amino acids in stabilisation of the chromophore and modulation of the excited-state proton transfer (ESPT) efficiency, providing a mechanistic basis for pH-sensitive lifetime and insensity measurements.
Collectively, the combined spectroscopy–modelling–MD framework links intramolecular water/chromophore dynamics to ESPT-controlled rates and establishes design rules for red fluorescent protein pH biosensors compatible with lifetime-based readouts, super-resolution/ultrafast fluorescence microscopy, and pump–probe photoacoustic reporting in vivo (See Fig.).