Our research focuses on understanding algal growth through intelligent sensing. We move from raw signals to biological insights, revealing dynamics that are invisible to daily sampling.
Experimental Setup: The Tubular Photobioreactor
We operate a tubular photobioreactor at the Institute of Physics to test our sensors and optimize cultivation strategies. The system combines closed-loop culture management with spectrally controllable LED lighting.

Key capabilities include:
- Comprehensive Sensing: Continuous recording of optical density, biomass, pigments, pH, and CO₂.
- Lighting Control: LEDs can be modulated in intensity and spectrum to simulate specific environmental conditions or induce metabolic changes.
- AI Integration: All data is collected via a networked system and evaluated in an AI-supported environment to model growth rates and metabolic shifts.
The “Mosaic” Sensor: Non-Invasive In-Situ Analysis
In collaboration with Sensoik Technologies GmbH, we developed the “Mosaic” multispectral sensor. It is designed for long-term, continuous monitoring directly on the reactor wall.

Key Features:
- Contactless Measurement: The sensor measures through the glass (or material) of the reactor. This means no sterile sampling is required, and there are no internal optical windows to suffer from biofouling.
- High-Resolution Optics: It combines a 16-channel hyperspectral detector with a 4-channel RGB+IR sensor and 6 integrated LEDs (UV to Near-Infrared).
- Deep Insights: We can separate absorption from fluorescence signatures, allowing us to determine cell density, pigment levels (chlorophyll/carotenoids), and morphological changes.
This sensor serves as the hardware basis for digital twins and automated process control in both research and industrial production.
The Mosaic sensor chip thus forms a measurement and data technology basis for scalable, automated, and explainable process control in photobioreactors — both in research and industrial algae production.
Research Highlights

High-Resolution Analysis of Biomass Growth
Standard algal monitoring often relies on manual daily measurements of growth parameters such as biomass. Our optical setup captures the temporal course of biomass continuously and effortlessly. The data in the plot reveals a fivefold increase in biomass over a ten-day period, but also captures fine-grained fluctuations and oscillations that standard sampling misses.
By analyzing the derivative of the growth curve, we can track the real-time growth rate. This high temporal resolution allows us to identify specific physiological phases and potential measurement artifacts immediately, offering a level of process control previously unavailable.

AI-Driven Classification of Physiological States
While monitoring biomass is essential, understanding the health of the culture is critical. Our machine learning models analyze the multidimensional optical data captured by the sensor to categorize algae based on their physiological condition, rather than just their density.
Key insights from the model:
- Distinct Signatures: By mapping optical features in 3D space, the AI clearly separates dead cells, healthy populations (supplemented with NPK), and nutrient-stressed populations.
- Stress Detection: The “Population without NPK” cluster exhibits a specific trajectory, distinct from the compact cluster of healthy cells. Upon detecting stress appropriate actions can be taken.
Time resolved fluorescence tomography
Investigators: Franz-Josef Schmitt, Fabian
Rieder
The Figure shows a lifetime plot of the pH values in a microwell plate determined with time resolved fluorescence tomography and pH sensitive marker molecules (fluorescein-isothiocyanate, FITC)
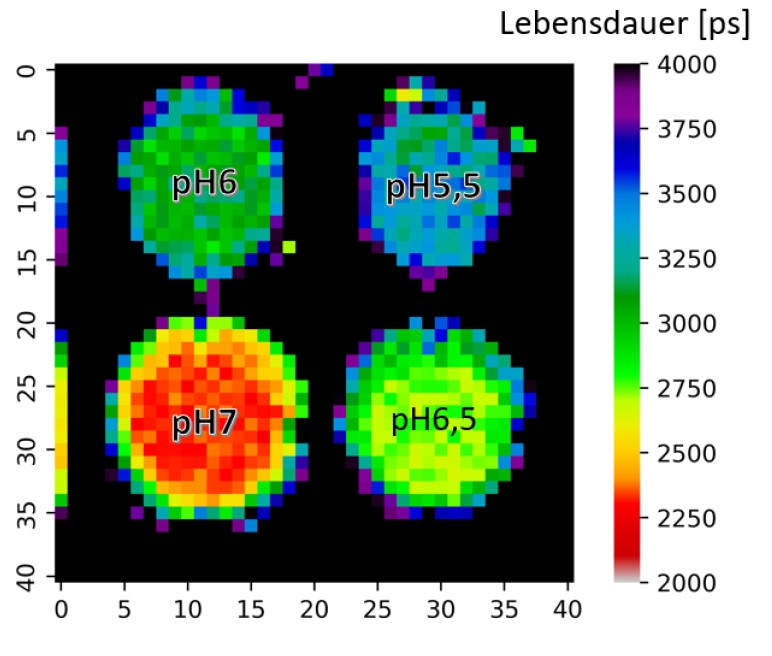
The group investigates time-resolved fluorescence tomography (FT) for three-dimensional visualization of fluorescent tissues with quantitative depth sensitivity. One goal is the determination of the local pH value by combining time resolved fluorescence with pH sensitive marker molecules.
In FT, tissue is excited—typically in the near-infrared window—and the resulting emission is recorded at multiple surface positions and viewing angles. Specific fluorescence markers with pH dependent fluorescence lifetime can be used to generate a 3D pH map of the tissue based on the local fluorescence lifetime (See Fig.).
The fluorescence lifetime is widely independent of the chromophore concentration and only marginally distorted by autofluorescent signals so that it represents a much better ruler for the pH as intensity based measurements.
Performance is assessed using tissue-mimicking phantoms and ex vivo samples to quantify spatial resolution, sensitivity, contrast-to-noise ratio, and absolute concentration accuracy.
Fluorescent molecules in cancer diagnostics
Investigator: Franz-Josef Schmitt
The figure shows that targeted mutations enhance fluorescent proteins by optimizing chromophore stabilisation, chromophore-water-interaction and excited-state proton transfer for bright sensors with strong pH sensitivity.
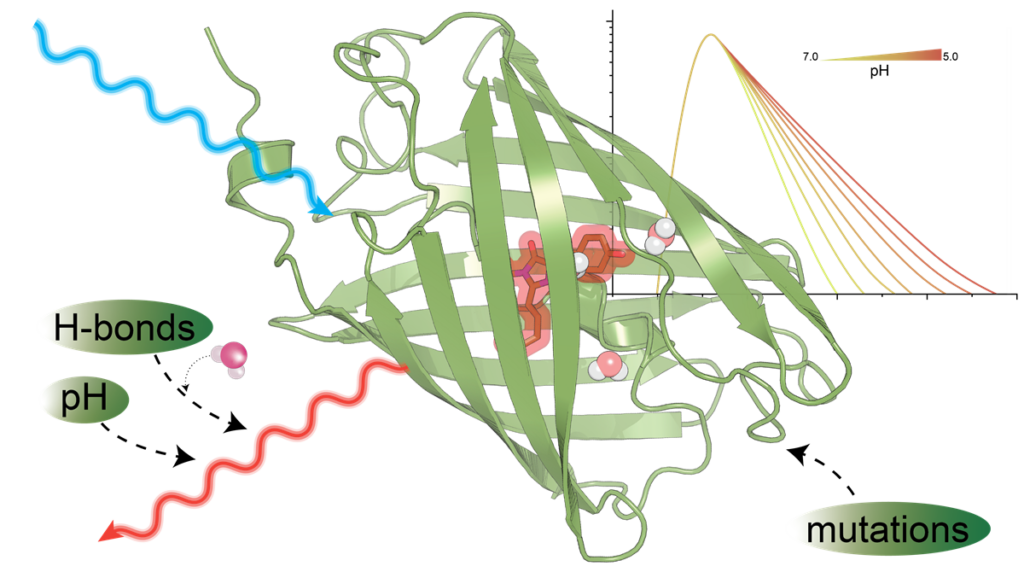
We dissect the pH dependence of far-red fluorescent proteins by coupling broadband absorption/emission spectroscopy with multichannel time-correlated single-photon counting (TCSPC) and decay-associated spectra (DAS) analysis. Kinetic models fitted to the DAS reveal the pH dependency of intramolecular relaxation channels and help to understand the interaction of the molecules with protons and support the specific design of optimized pH sensors.
Molecular dynamics (MD) at different protonation states rationalize the observed photophysics and give rise to understanding the role of specific amino acids in stabilisation of the chromophore and modulation of the excited-state proton transfer (ESPT) efficiency, providing a mechanistic basis for pH-sensitive lifetime and insensity measurements.
Collectively, the combined spectroscopy–modelling–MD framework links intramolecular water/chromophore dynamics to ESPT-controlled rates and establishes design rules for red fluorescent protein pH biosensors compatible with lifetime-based readouts, super-resolution/ultrafast fluorescence microscopy, and pump–probe photoacoustic reporting in vivo (See Fig.).